---
title: Power BI Documenter October 2018 Release
description: The new release of Power BI Documenter provides lots of new information about your Power BI reports along with one more best practice.
image: https://www.datavizioner.com/hubfs/documenter%20update.png
---
[](https://www.datavizioner.com)
- [Platform](https://www.datavizioner.com/platform)
## [Platform at a glance ](https://www.datavizioner.com/platform)
##### **[Watch: Platform Overview](https://www.loom.com/share/aead85255d474aa8976a2849e5a0846a)**
### [Enhance governance Build trust in your data and navigate regulatory requirements.](https://www.datavizioner.com/platform)
### [Power BI Documenter Document, review and improve your Power BI reports and models.](https://www.datavizioner.com/power-bi-documenter)
### [Explore lineage Improve accuracy and identify issues before they cost you.](https://www.datavizioner.com/platform)
### [Power BI Exporter Easily export data from Power BI with a single click - completely free.](https://www.datavizioner.com/power-bi-exporter)
### [Automate documentation Save time with efficient enterprise and self-service collaboration.](https://www.datavizioner.com/platform)
### [Additional connectors Integrate datasets, reports and dashboards from other sources.](https://www.datavizioner.com/additional-connectors)
- [Services](https://www.datavizioner.com/services)
- [Resources](https://www.datavizioner.com/resources)
## [Get help and updates ](https://www.datavizioner.com/resources)
##### **[Watch: Self-service BI, and its perils](https://www.loom.com/share/4b577b30913e433f8f07642d25a85877)**
### [Insights Keep on top of the latest trends in data and business intelligence.](https://www.datavizioner.com/resources)
### [Case studies See how customers are managing risks and improving productivity.](https://www.datavizioner.com/resources/tag/case-studies)
### [Product updates Hear about the latest updates and learn how to leverage them.](https://www.datavizioner.com/resources/tag/product-updates)
### [Partners Find a partner to augment your internal team's capabilities.](https://www.datavizioner.com/partners)
### [Support Get in touch with our friendly team, and we'll help you out.](https://www.datavizioner.com/contact)
- [Pricing](https://www.datavizioner.com/pricing)
- [Enterprise](https://www.datavizioner.com/pricing/enterprise-government)
[Login](https://app.datavizioner.com/) [START FOR FREE](https://app.datavizioner.com/signup)
Product Updates
# Power BI Documenter October 2018 Release
The new release of Power BI Documenter provides lots of new information about your Power BI reports along with one more best practice.
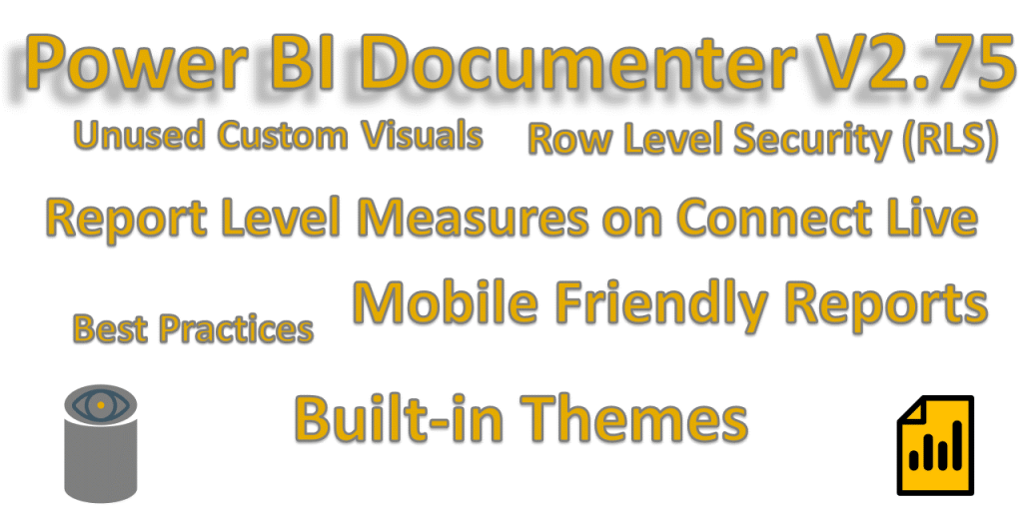
We’re excited to announce that **Power BI Documenter V2.75** (October 2018) has been released for public use. The new release of Power BI Documenter provides lots of new information about your Power BI reports along with one more best practice. In this release we fixed some bugs and added bunch of new features as follows.
### Fixed bugs in the new release?
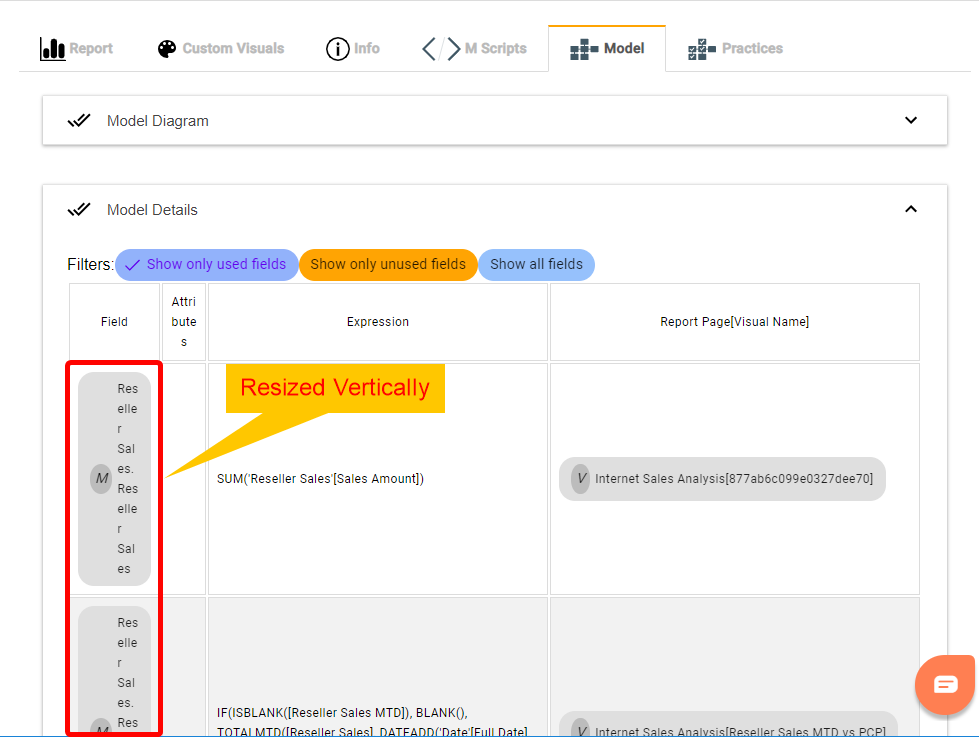
We have noticed a minor bug in “Model Details” data grid under “Model” tab which the “Field” column resized vertically and made it pretty hard to read the text.
[](https://static.hsstatic.net/BlogImporterAssetsUI/ex/missing-image.png)
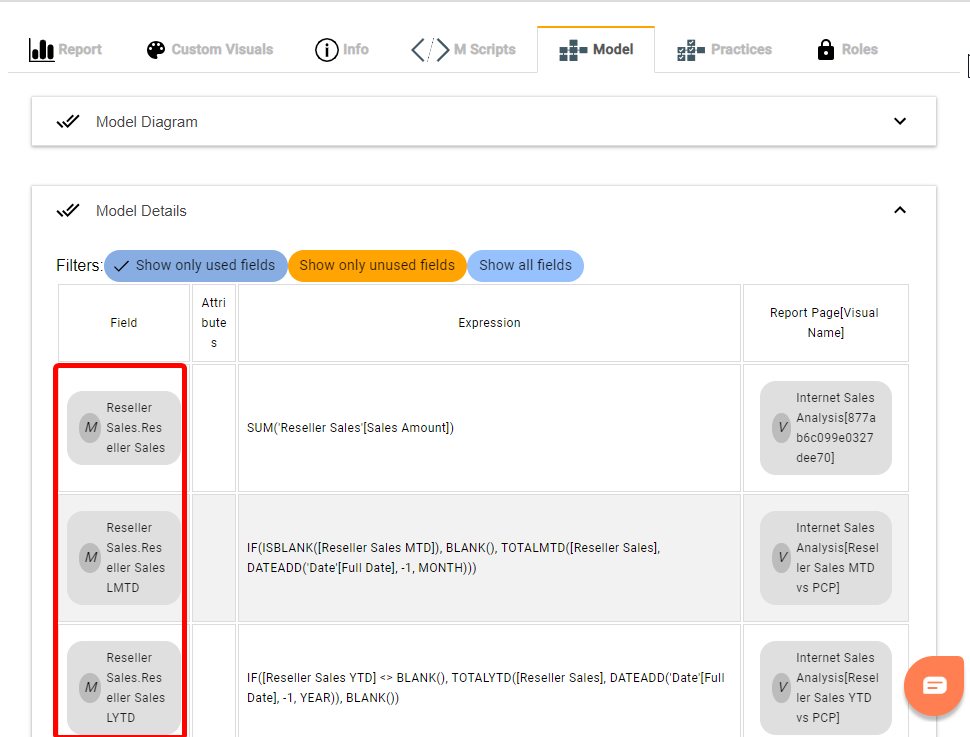
We fixed the issue so the “Filed” text will not resize in a way that makes the text unreadable.
[](https://static.hsstatic.net/BlogImporterAssetsUI/ex/missing-image.png)
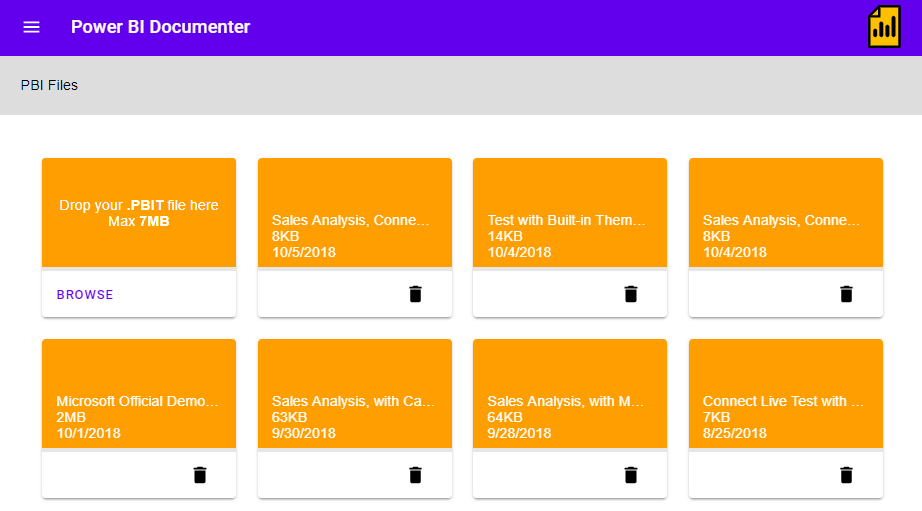
We also notified with an issue in the sorting files in the “Files” page. In this release we fixed that issue and from now on your files will be in descending order based on uploaded date.
[](https://static.hsstatic.net/BlogImporterAssetsUI/ex/missing-image.png)
### What is new in October 2018 release?
Power BI Documenter 2.75 comes with a bunch of amazing new features that can help you with your Power BI development as well as documenting your Power BI reports.
- Supporting built-in themes
- Detecting unused custom visuals and providing relevant Best Practice
- Detecting Mobile Friendly reports and visuals
- Row Level Security (RLS)
- Report Level Measures when Connect Live to an instance of SSAS
#### Supporting built-in Themes
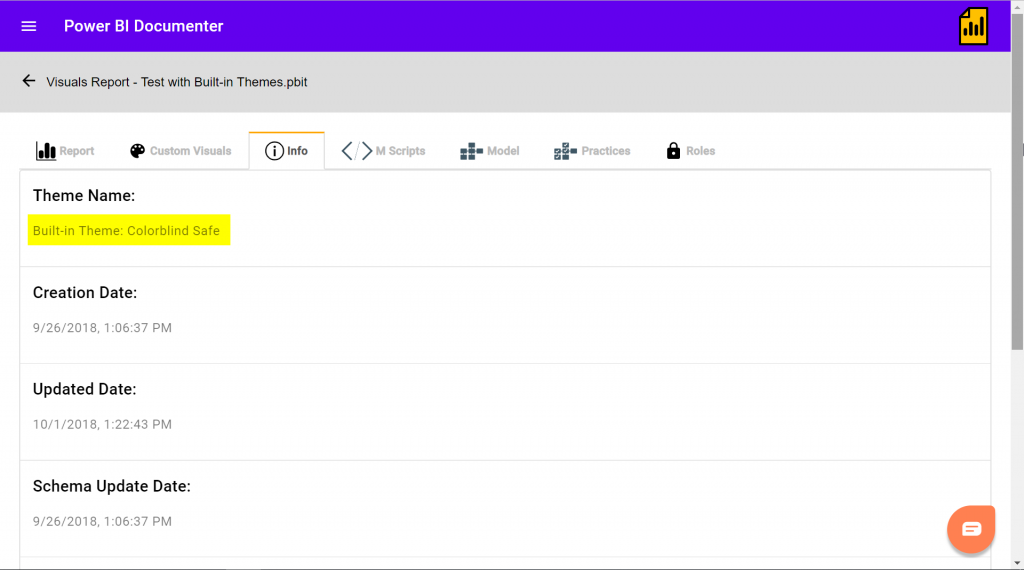
Built-in Themes made available in Power BI Desktop from August 2018. From now on Power BI Documenter detects if a “Built-in” theme has been used in the Power BI reports.
[](https://static.hsstatic.net/BlogImporterAssetsUI/ex/missing-image.png)
#### Detecting unused custom visuals
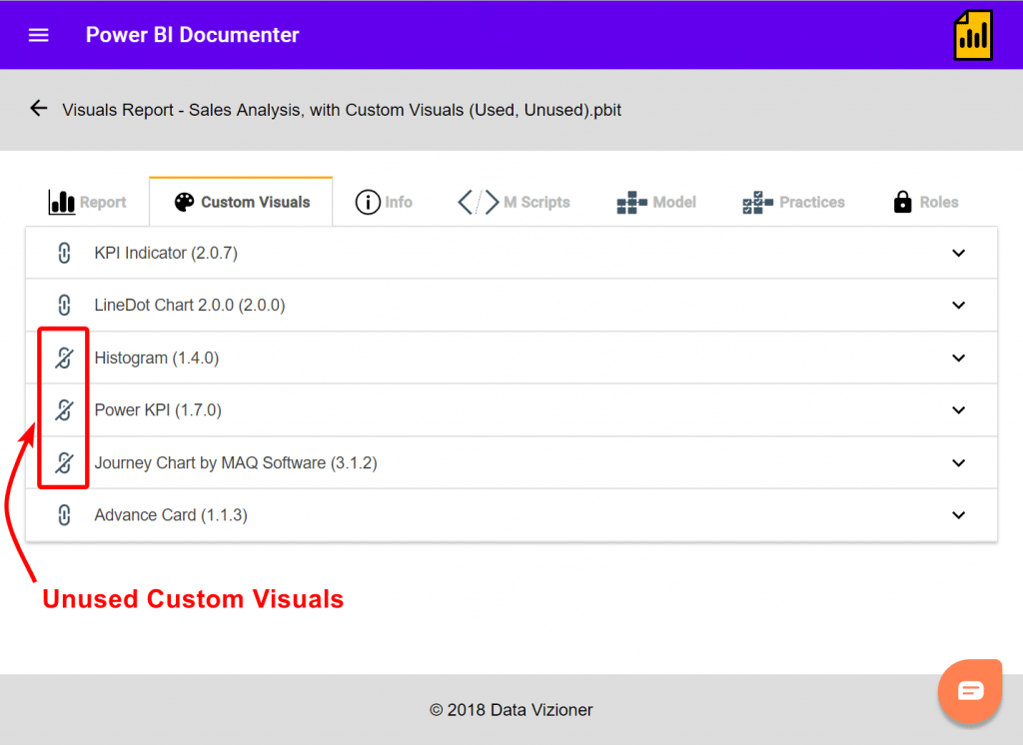
The ability to use custom visuals is awesome. They can take your reports to the whole another level. They are shiny, informative and more importantly, easy to import to your reports. No scripting is needed, you just need to import any desired custom visual to your Power BI report to be able to use them. But, in reality you may import several custom visuals to see how they work. You may use some, but what about the unused ones? You may simply forget to remove them from your model. The problem with unused custom visuals is that they still consume some space in your Power BI report which make your PBIX and PBIT files larger. This release of Power BI Documenter can detect unused custom visuals so you will immediately identify unused ones in your report which perhaps you’d like to remove them as soon as you can. To see which custom visuals are not used in your report, after uploading your PBIT file to Power BI Documenter, click on “Custom Visuals” tab.
[](https://static.hsstatic.net/BlogImporterAssetsUI/ex/missing-image.png)
#### Best Practice on Unused Custom Visuals
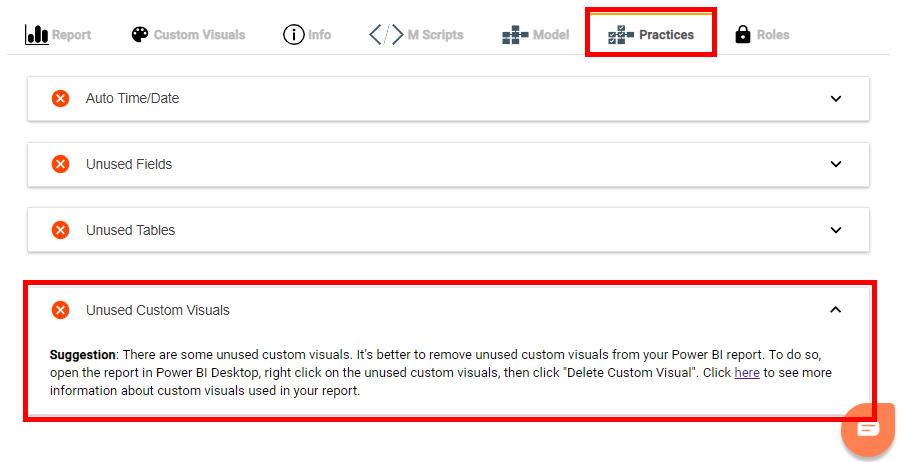
We added a new best practice about unused custom visuals. If you have at least one unused custom visual you will see the following message under “Practices” tab in “Unused Custom Visuals” dropdown:
[](https://static.hsstatic.net/BlogImporterAssetsUI/ex/missing-image.png)
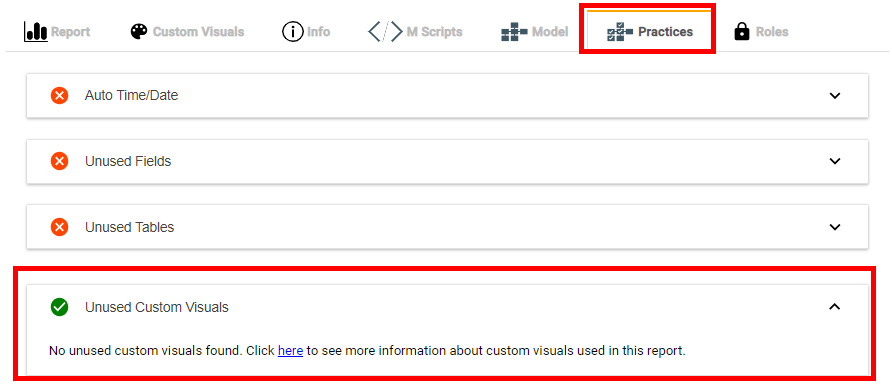
Otherwise you see the following green tick:
[](https://static.hsstatic.net/BlogImporterAssetsUI/ex/missing-image.png)
#### Detecting mobile friendly reports and visuals

One of the features available in Power BI that is loved by the end users and customers is “Mobile Friendly” reports. You can easily make wonderful reports that can be easily used on virtually any mobile devices. But, when it comes to Power BI documentation and handover, it is really hard to go through every single report page, switch to “Phone Layout” and see which visuals are used in mobile friendly mode. Using Power BI Documenter you save heaps of time on identifying mobile friendly reports and visuals. All you need to do is to upload your PBIT file to Power BI Documenter then under “Report” page you’ll see icon if a Phone Layout is available for the report pages and if visuals are used in the Phone Layout.
#### Row Level Security (RLS)
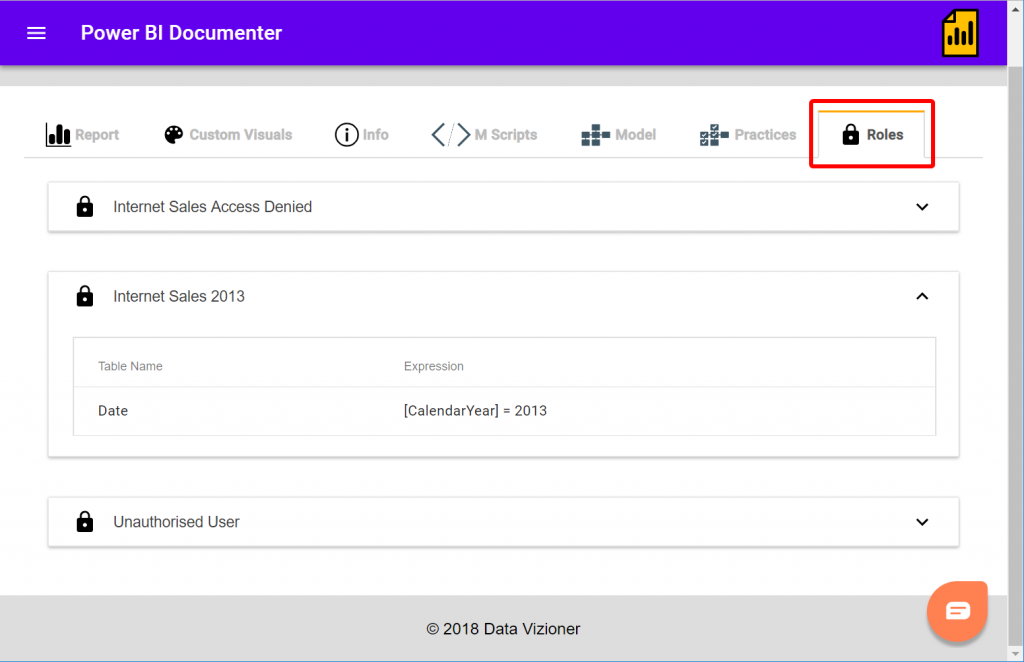
The October 2018 release of Power BI Documenter supports “Row Level Security (RLS)”. So from now on you’ll get your RLS settings documented after uploading your PBIT file to Power BI Documenter. Then click on a new “Roles” tab added to the Documenter. You can simply expand the dropdown to see the expressions used in the RLS.
[](https://static.hsstatic.net/BlogImporterAssetsUI/ex/missing-image.png)
### Report level measures when Connect Live to an instance of SSAS
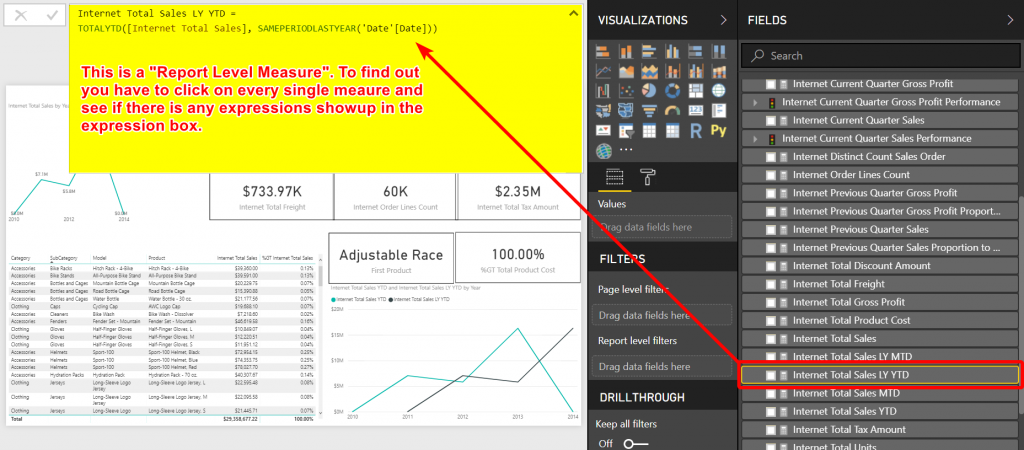
One of the coolest features of Power BI Desktop is the ability of creating Report Level Measures when connecting live to an instance of SSAS Tabular. This features opens the doors to SSAS Tabular development team to work more closely with Power BI developers in an enterprise scale project. The way it works out is that Power BI developers can create new measures in their Power BI reports when needed. So they don’t need to wait for the SSAS Tabular developers to create the measures and deploy the solution to make the measures available for Power BI developers. As a matter of fact, after the Power BI developers create the Report Level Measures in Power BI, they can simply handover the DAX expressions to SSAS Developers to use those expressions to create the measures in Tabular model. Currently, in Power BI Desktop, there is no easy way to identify the Report Level Measures. It can get a serious problem when you open a Power BI Desktop that someone else developed and you need to identify Report Level Measures. The only way in Power BI Desktop is to click on every single measure in the “Fields” pane and see if any expressions show up in the expression box. Imagine if you have a Power BI report connected to a Tabular model with hundreds of measures and you need to find out which measure is actually a Report Level Measure; that can be a real nightmare.
[](https://static.hsstatic.net/BlogImporterAssetsUI/ex/missing-image.png)
We at Data Vizioner identified this time-consuming process and we are excited to make this feature available in October 2018 release of Power BI Documenter. So from now on, you can simply upload your PBIT file to Power BI Documenter with a simple click, then go to “Model” tab and you can see full information about the “Report Level Measures” and their DAX expressions. We didn’t stop there, in the “Model” page we give you full information about the measure usage in Report Pages and Visuals.
LEADING DATA INTELLIGENCE PLATFORM
Enhance governance, accelerate analysis and automate documentation with a single data intelligence platform.
[GET A FREE ACCOUNT](http://app.datavizioner.com/signup)
EBOOK
## Get our free ebook on how you can level up your B2B SaaS content marketing
Get our free ebook on how you can level up your B2B SaaS content marketing
[Data Vizioner](https://www.datavizioner.com/resources/author/data-vizioner)
10 October 2018
[mailto:?subject=Check%20out%20https://www.datavizioner.com/resources/power-bi-documenter-october-2018-release&utm_medium=social&utm_source=email%20&body=Check%20out%20https://www.datavizioner.com/resources/power-bi-documenter-october-2018-release&utm_medium=social&utm_source=email](mailto:?subject=Check%20out%20https://www.datavizioner.com/resources/power-bi-documenter-october-2018-release&utm_medium=social&utm_source=email%20&body=Check%20out%20https://www.datavizioner.com/resources/power-bi-documenter-october-2018-release&utm_medium=social&utm_source=email)
## Similar posts
Product Updates
### [Power BI Documenter December 2018 Release](https://www.datavizioner.com/resources/power-bi-documenter-xmas-2018-release)
The new release of Power BI Documenter comes with new fascinating features that makes your lives even easier on your day-to-day Power BI engagements.
Data Vizioner Dec 18, 2018
Company News
### [Introducing Power BI Documenter](https://www.datavizioner.com/resources/how-to-use-power-bi-documenter)
This post takes you through everything you need to know to start documenting, reviewing and improving your Power BI reports more effectively.
Data Vizioner Jun 10, 2018
Product Updates
### [New Power BI Service Connector for Fabric](https://www.datavizioner.com/resources/power-bi-service-connector)
Import and refresh semantic models and reports from Power BI Service in just a few clicks.
Data Vizioner Apr 22, 2025

Industry leading data intelligence to enhance governance, explore lineage and automate documentation across your organization.
### Popular
- [Platform](https://www.datavizioner.com/platform)
- [Services](https://www.datavizioner.com/services)
- [Pricing](https://www.datavizioner.com/pricing)
- [Enterprise](https://www.datavizioner.com/pricing/enterprise-government)
### Products
- [Power BI Documenter](https://www.datavizioner.com/power-bi-documenter)
- [Power BI Exporter](https://www.datavizioner.com/power-bi-exporter)
- [Power BI Service Connector](https://www.datavizioner.com/additional-connectors)
- [Analysis Services Connector](https://www.datavizioner.com/resources/connect-to-analysis-services)
### Resources
- [Insights](https://www.datavizioner.com/resources)
- [Case studies](https://www.datavizioner.com/resources/tag/case-studies)
- [Product updates](https://www.datavizioner.com/resources/tag/product-updates)
- [Partners](https://www.datavizioner.com/partners)
### Support
- [10 minute overview](https://www.datavizioner.com/power-bi-documenter)
- [Specialist support](https://www.datavizioner.com/contact)
- [Upgrade account](https://www.datavizioner.com/contact)
- [Become a partner](https://www.datavizioner.com/partner-program)
Copyright © 2026 Data Vizioner Limited | [Privacy Policy](https://get.datavizioner.com/privacy-policy) | [Terms of Use](https://get.datavizioner.com/terms-of-use)
```json
{
"@context" : "https://schema.org",
"@type" : "BlogPosting",
"author" : {
"@type" : "Person",
"name" : "Data Vizioner",
"url" : "https://www.datavizioner.com/resources/author/data-vizioner"
},
"dateModified" : "2022-05-09T07:01:59.583Z",
"datePublished" : "2018-10-10T23:35:44.000Z",
"headline" : "Power BI Documenter October 2018 Release",
"image" : [ "https://www.datavizioner.com/hubfs/documenter%20update.png" ],
"mainEntityOfPage" : {
"@id" : "https://www.datavizioner.com/resources/power-bi-documenter-october-2018-release",
"@type" : "WebPage"
},
"publisher" : {
"@type" : "Organization",
"logo" : {
"@type" : "ImageObject",
"url" : "https://www.datavizioner.com/hubfs/at-2.png"
},
"name" : "Data Vizioner"
}
}
```