Product Updates
Analyse relationships and dependancies
Last year was a phenomenal year, and what better way to kick off 2020 than with a bunch of new features.
The new release of Power BI Documenter helps you with data modelling best practices, along with new feature for model analysis.

We’re excited to announce that Power BI Documenter V2.5 (August 2018) has been released for public use. The new release of Power BI Documenter, not only does help you with your Power BI documentation and handover processes, but also it helps you with some data modelling best practices. We have modified an existing feature and added lots of new features under two new tabs, “Model” and “Practices”.
From now on, Power BI Documenter can detect “Composite Models” as connection type. As you may know “Composite Models” is a new feature Microsoft added to Power BI in July 2018.
While this feature only available in preview, we at DataVizioner decided to support this feature in our August 2018 release.
In this release of Power BI Documenter added lots of new features related to the data model. From now on you are able to see your “Model Diagram” as well as DAX expressions for calculated columns, measures and calculated tables. You can also see what Tables, Columns and Measures are directly used in your report visuals; and which ones are NOT directly used in the visuals. We use colour coding in the “Model Diagram” to make it more readable and easier to connect with.
This tab provides lots of information about your data model. You will see three sections in the Model tab.
In this section you see a graphical view of the data model which includes tables and their relationships. The “Model Diagram” leverages colour codes and tags to quickly provide information about your data model.
Here is more details about Model section:
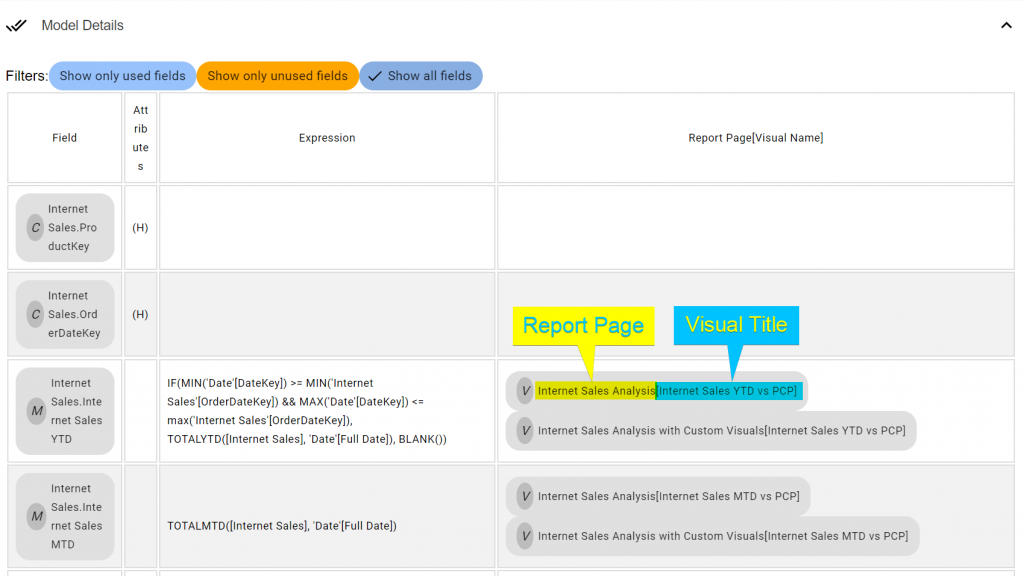
This section contains more details about your data model including Tables, Field, Attributes, Expression, Report Page and if they are used in visuals.
You can filter the “Model Details” by clicking on three different filters available in this section.
You can combine the filter with selecting a table from the “Model Diagram” to restrict the data grid showing only used or unused fields from a certain selected table.
A field in a table can be a column or a measure. There are two tags used to show the type of the field:
The field name follows the syntax below:
[Table_Name].[Field_Name]
A column can be a calculated column or a normal column. It can also be hidden. We used two tags under “Attributes” to show if a column is a “Calculated Column” and/or is “Hidden”:
You can find DAX expressions for calculated columns and measures.
Represents the report page and the visual(s) that a corresponding field is used in. We used “Report Page[Visual Name]” structure to address the visuals. So in “Internet Sales Analysis[Internet Sales MTD vs PCP]”, “Internet Sales Analysis” is the report page name and “Internet Sales MTD vs PCP” is the visual title.
This section shows the tables properties like if table is a Calculated Table or Hidden along with the table storage type that can be “Direct Query”, “Import” or “Dual”.
In this section you can see Calculated Tables with their corresponding DAX expressions. As mentioned earlier, clicking on a table in the model diagram filters this section. So if you click on a Calculated Table (with (CT) tag) you can see the DAX expression of that Calculated Table. If you do not select anything then you’ll see all Calculated Tables with their corresponding DAX expressions.
From now on Power BI Documenter is capable of examining your Power BI Template files against some best practices. This version of Power BI Documenter examines your PBIT files against three best practices as follows:
It is recommended to disable “Auto Date/Time” in Power BI. Despite the fact that “Auto Date/Time” is an easy to use feature that automatically creates Date hierarchies in your model, there are many side effects costs coming with this feature like loading lots of unnecessary Date related data into your model which potentially hits the performance and increases you model storage size. Best practice is to disable “Auto Date/Time” feature from Power BI properties.
Power BI Documenter seamlessly examines your model, if your model passes the test then you get the following message with a green tick:
Otherwise you see the following message with a red cross:
It is best not to have any visible columns or measures that haven’t been used in any visuals. The reason is that your model can easily get confusing if you do not take care of unused columns or measures. Having lots of column and measures that never been directly used in the visuals can cost you poorer performance, bigger Power BI storage and more memory consumption. For the above reasons it is best practice to review all unused columns and measures and either hide them in your model to keep your model tidy or safely remove them form your model which helps your model with less storage and memory consumption. From now on, Power BI Documenter examines your model, if you don’t have any unused fields in your model then you get a green tick:
otherwise, you get a red cross with a relevant suggestion:
It is recommended to hide a table if none of its columns or measures are used in any visuals. In some cases you need to keep those tables in your model like when you are managing many-to-many relationships. But, it is wise to hide them from report view to keep your model nice and tidy. However, there are some other cases that you really don’t need to keep those tables in your model. This section helps you with detecting any unused but visible tables so you can review your model and see if you want to keep those table in your model or you can safely remove them from your model and free up some memory and storage space. Power BI Documenter examines your model and shows a green tick in case the model the tests:
otherwise it shows a red cross with relevant suggestion:
Last year was a phenomenal year, and what better way to kick off 2020 than with a bunch of new features.
New external tool enables rapid analysis of data models in Azure Analysis Services and SQL Server Tabular models.
The new release of Power BI Documenter provides lots of new information about your Power BI reports along with one more best practice.